Property Managment & CRM | Brick Kiln
Company
Brick is a real estate and property management startup based out of Utah. I joined the company in its early stages and worked with the founders to build a brand, design software and experiences and craft strategy for the product and it's development. this included several pivots as we worked to find our place in the crowded prop-tech market.
Deliverables:
- Interaction Design
- High Fidelity Interactive Prototypes for Key tasks
- UI/UX Design
- Competitive Analysis
- Personas
- User Journeys & Task flow
- Site Map
- Low Fidelity Wireframes
- High Fidelity Mockups and Prototypes
- Design System and UI Kit
- Usability Testing
My Roles:
- User Experience (UX) Designer
- User Interface (UI) Designer
- Interaction (IxD) Designer
- Visual Designer
Specifications:
Duration: 6 Week MVP, Ongoing Development
Tools: Figma, Adobe Illustrator, Adobe Photoshop

Overview
Originally built as a Project Management solution to facilitate the documentation of real estate transactions the software needed to be reworked to allow our team to move on from Salesforce. This required additional CRM features to support project management tools, chat features and activity logs.
Design Process
Research & Define Problems
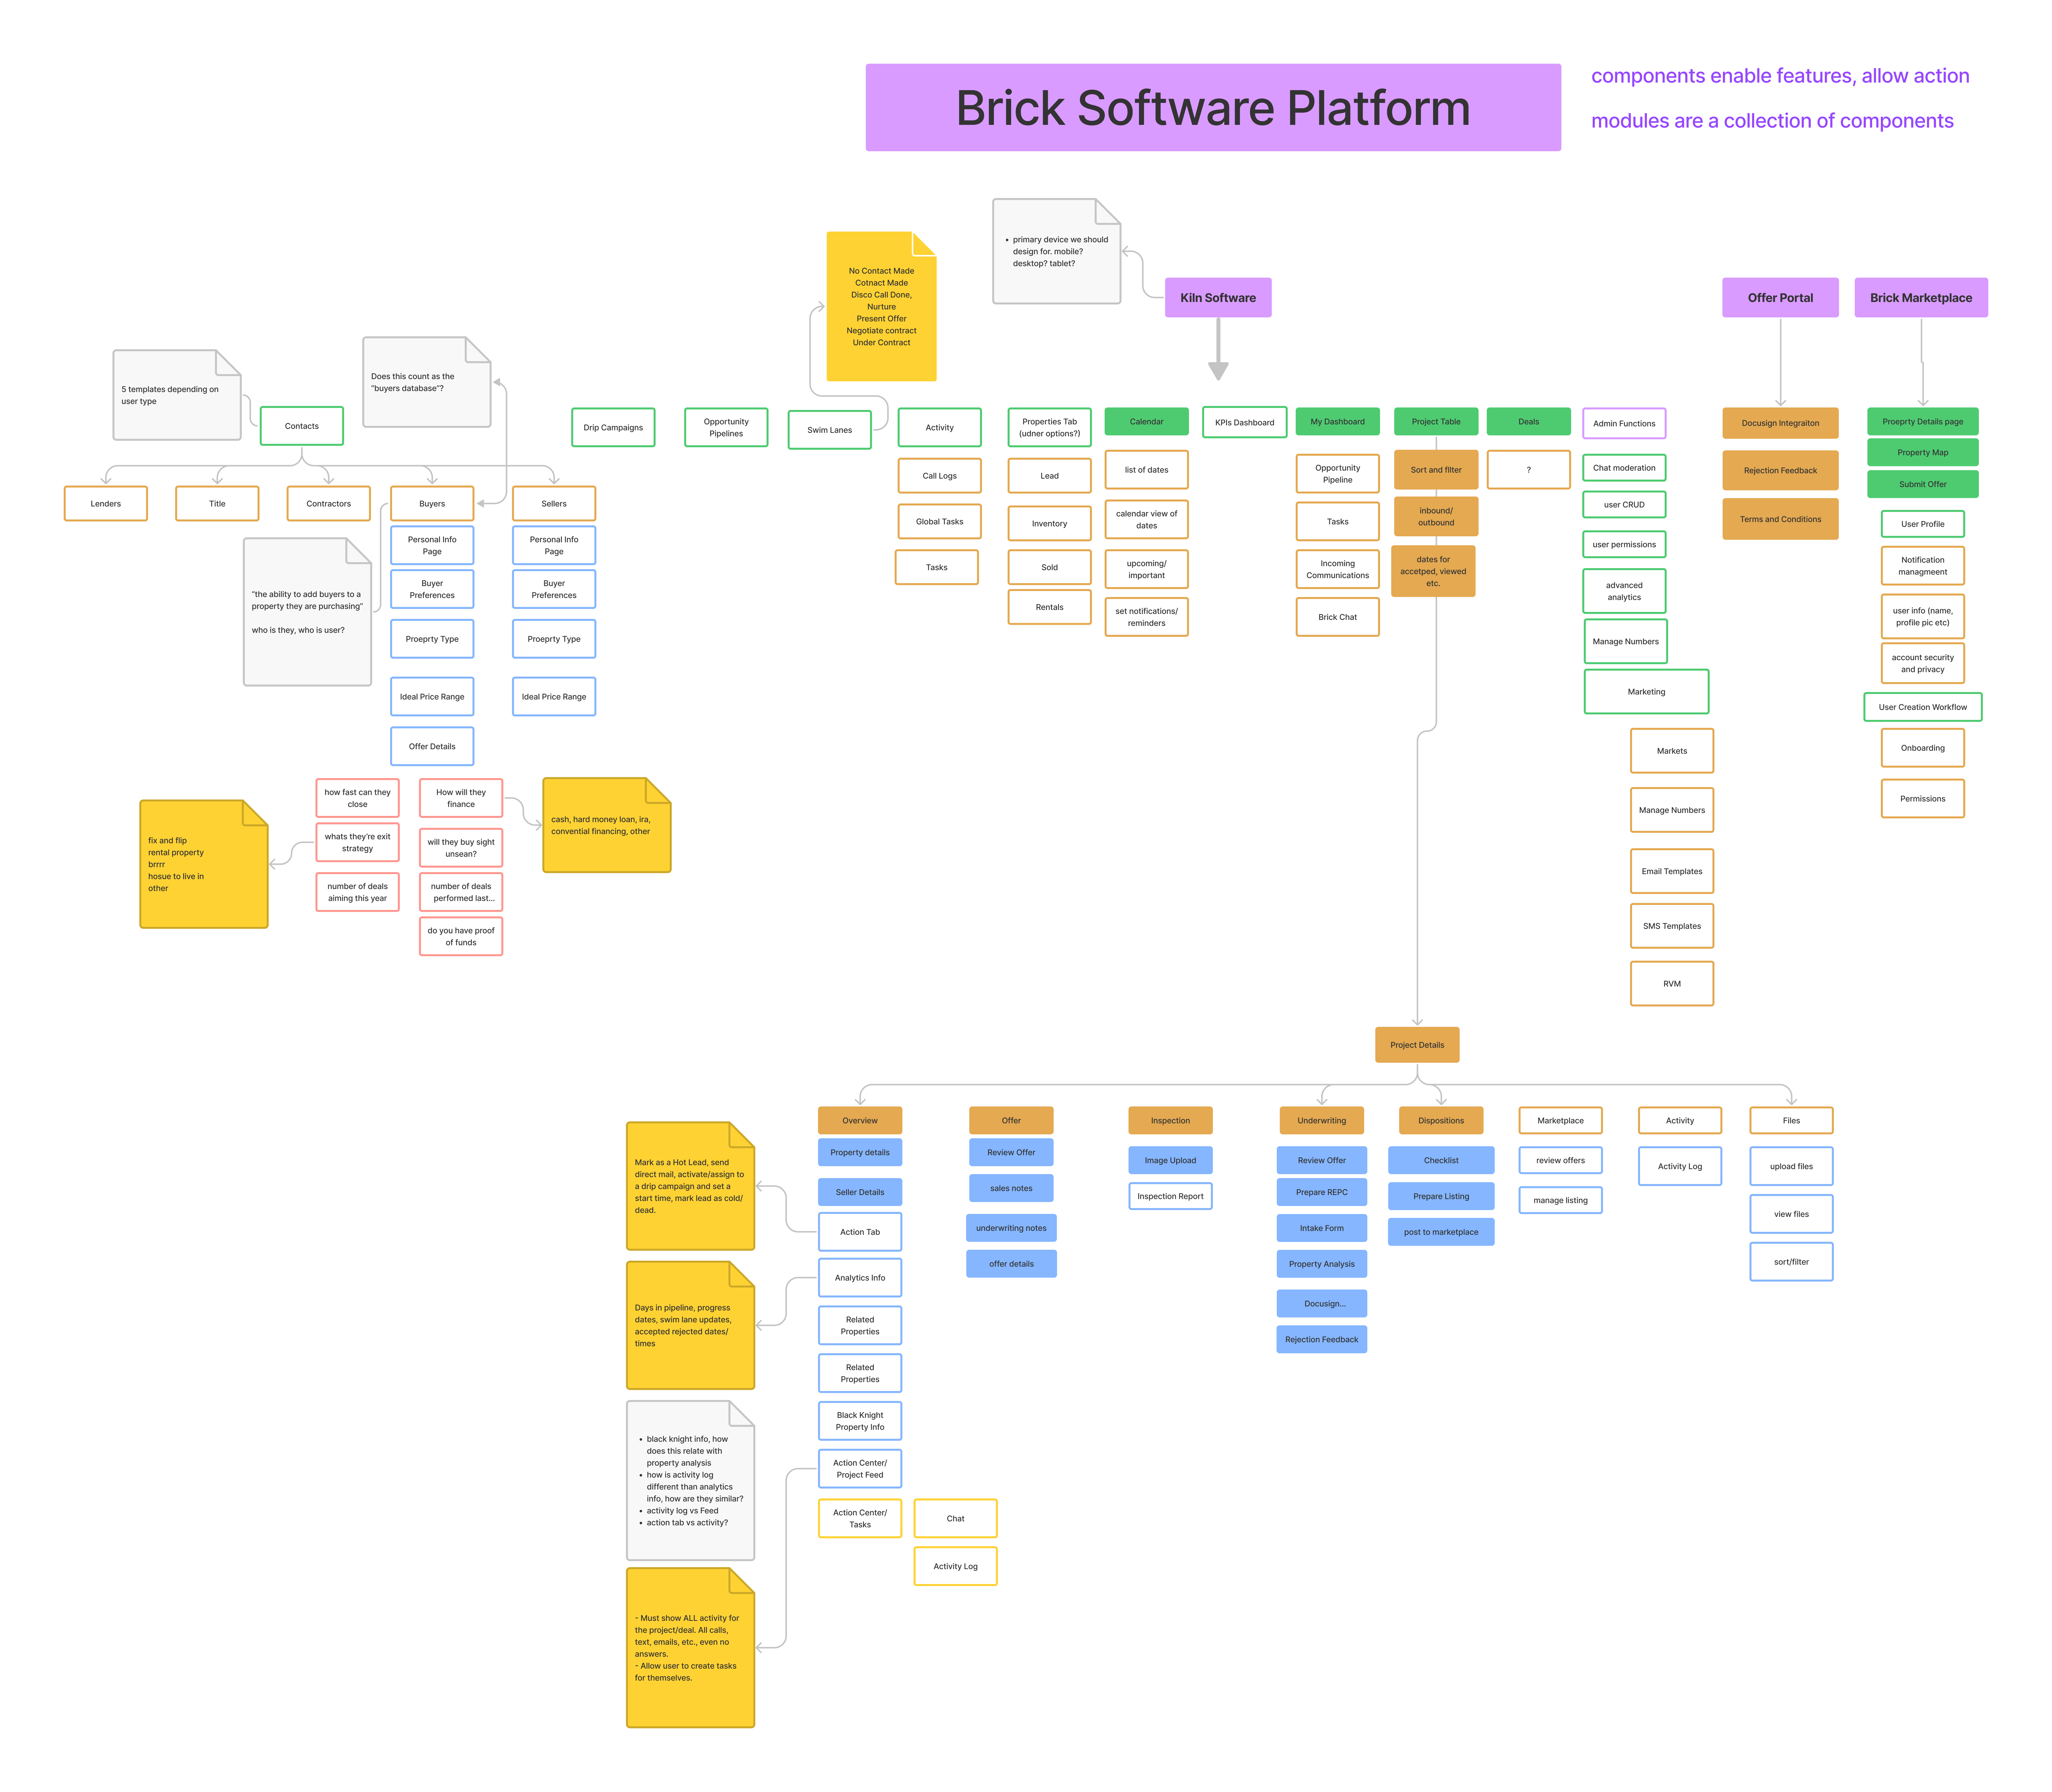
I spent time working with stakeholders to outline what features would be most helpful in the short term for agents. We would need to replicate some of the more basic features of Salesforce while building them in a way that overcame the shortcomings experienced there. Using this as a basis I blocked out a diagram of features to try and get a rough scope of the work involved.

Findings
- Most important features to design and develop are:
- communications chat platform
- activity log for auditing and compliance
- task tracker for visibility
- Global Pipeline of projects/properties
- KPI tracking of agents and their productivity.
with the goal of not having to renew a salesforce contract these were our key objectives and formed the start of what we needed to research and design. I also discovered a previously not communicated expectation for notifications via pop up that would inform users of new tasks, changes to projects and new messages.
Problems
- Notifications on a user level require a lot of support on the development side specifically a notification management system to control frequency, variety etc.
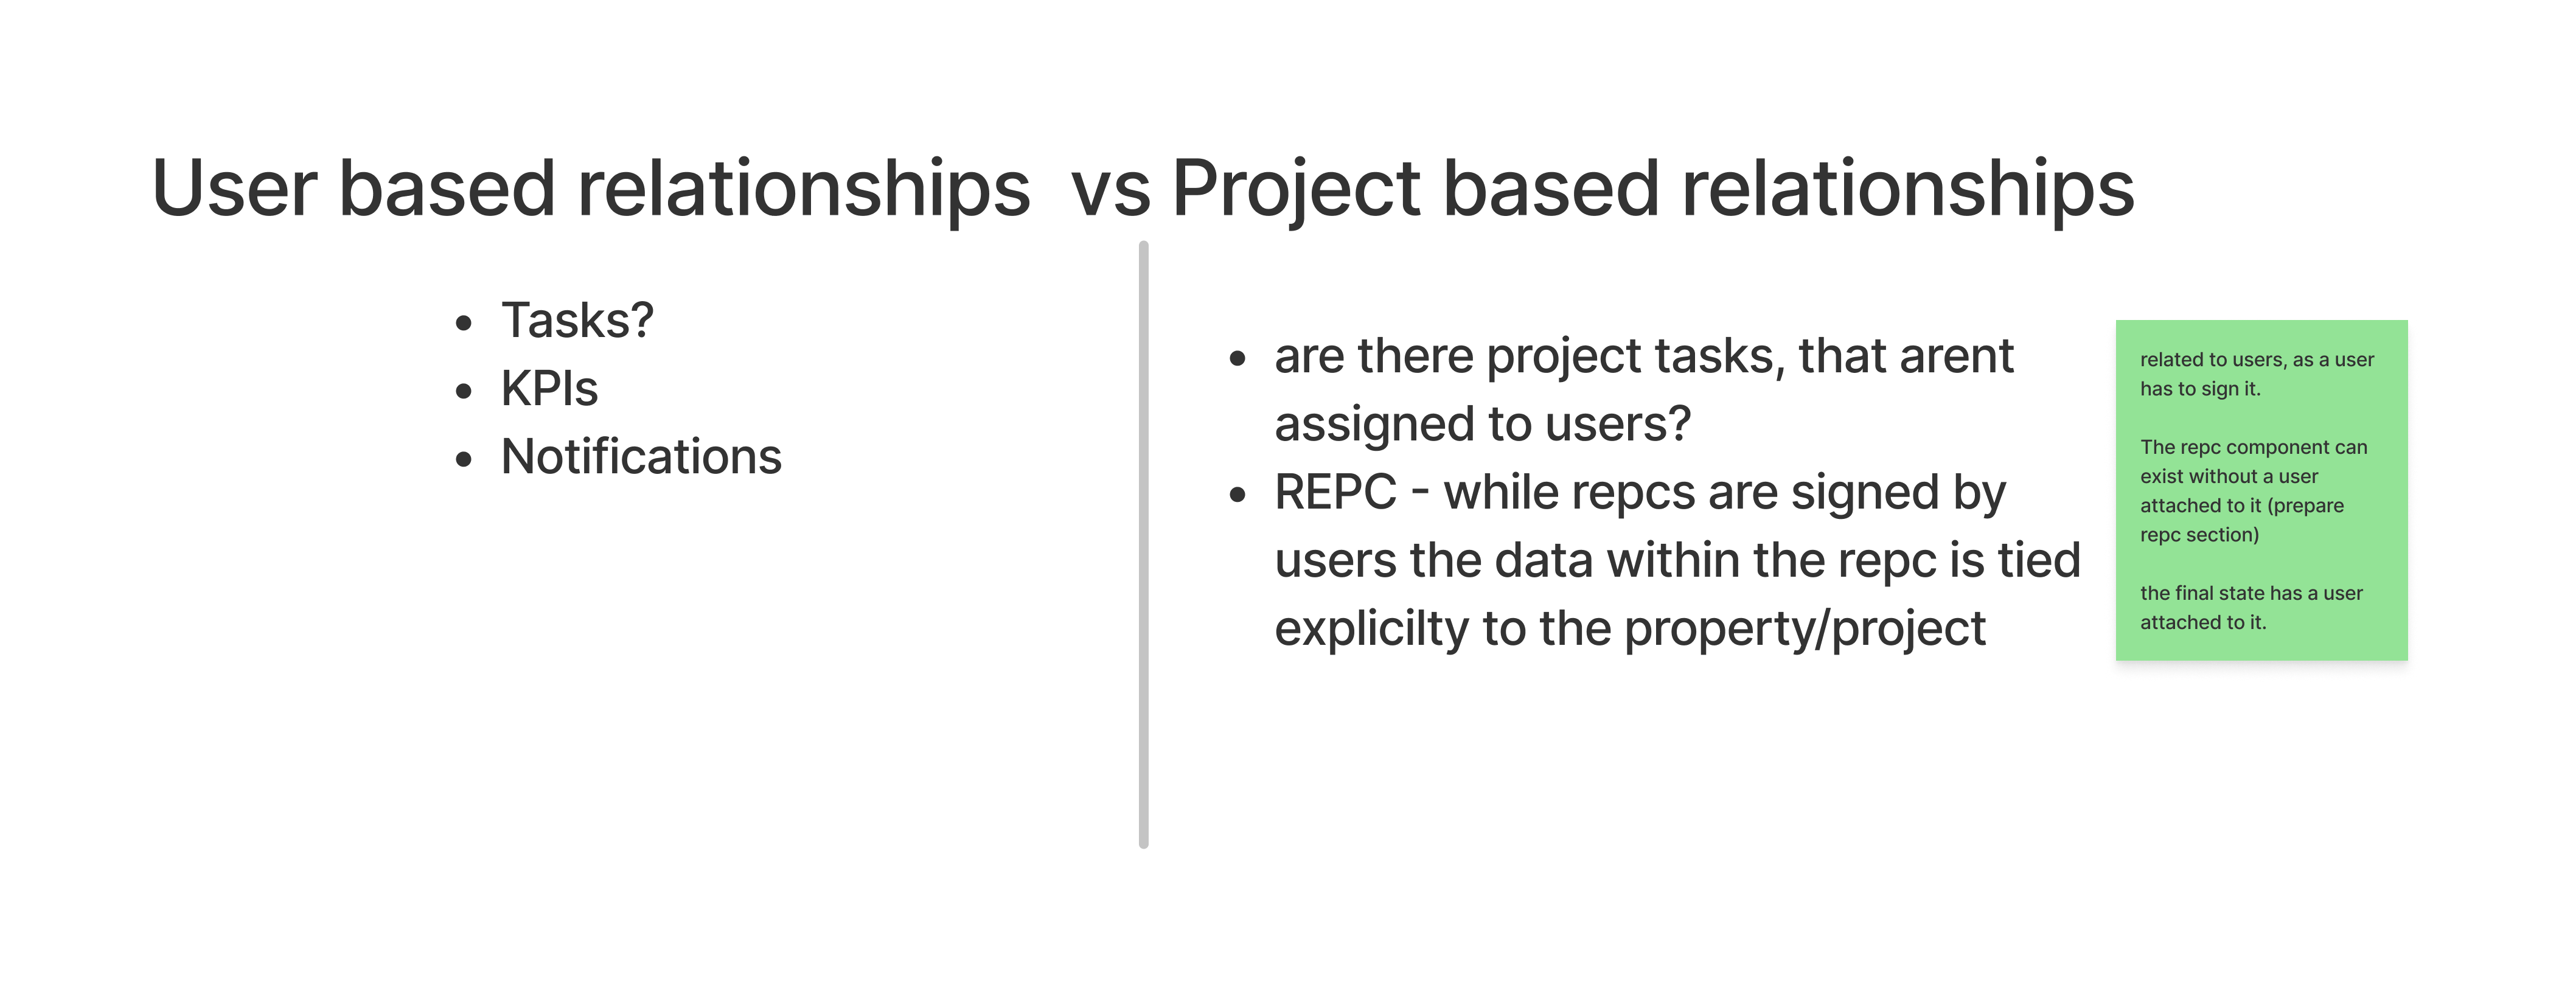
- What is the best way to build the hierarchy of information? Around projects or around users. Do we attach tasks to users or the projects their assigned to? How does that apply to assigned tasks?
- How do we manage the 15+ swim-lanes on the global pipeline?
- How do the new features interact with legacy features and incoming data visualization?
Strategy & Analysis
Working with the development team and stakeholders I built out a diagram to inform how various systems were interacting with each other. One of the benefits of this kind of diagram is that it gives a rough estimate of work to be completed and led to a harder look at how much work critical systems would be to build.
KPI Feature
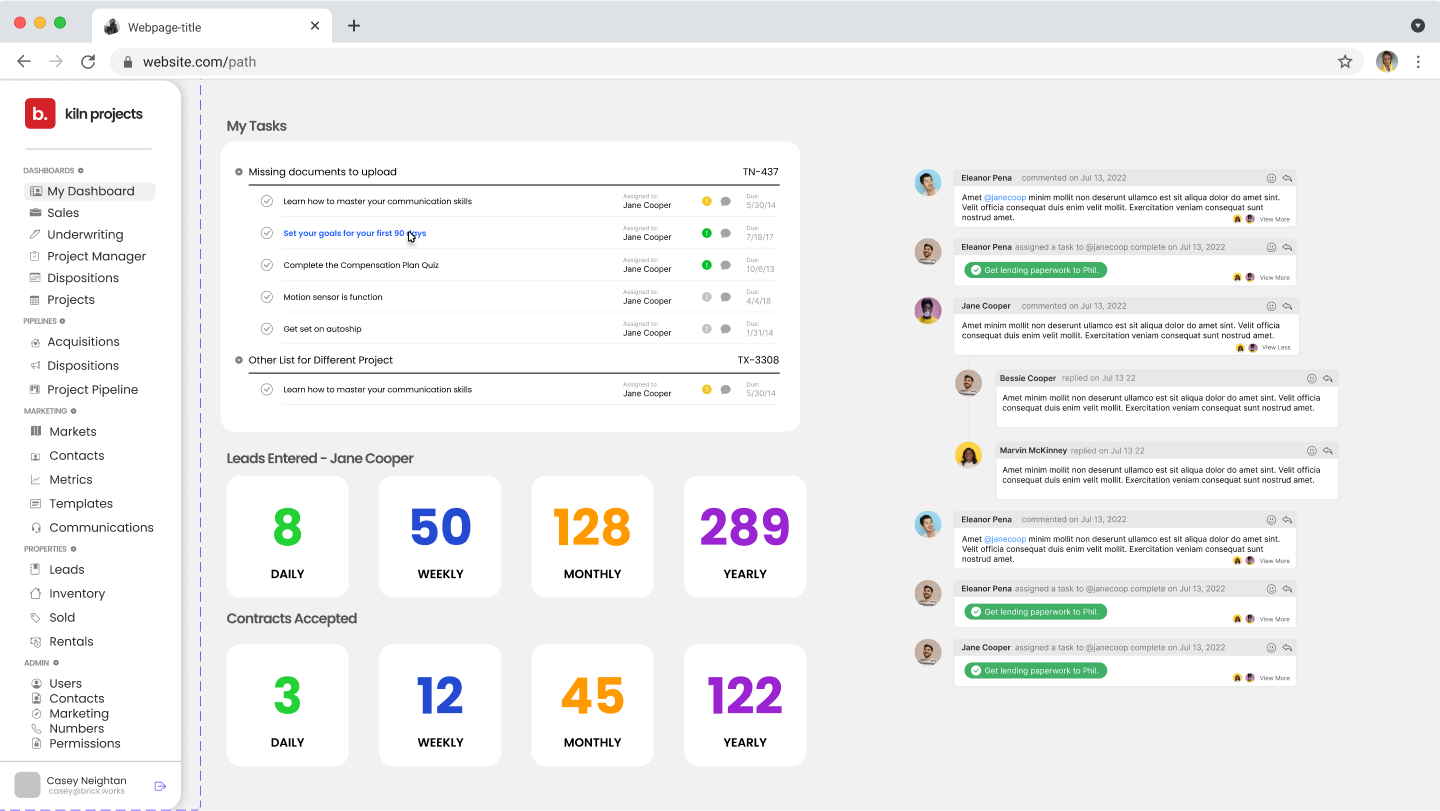
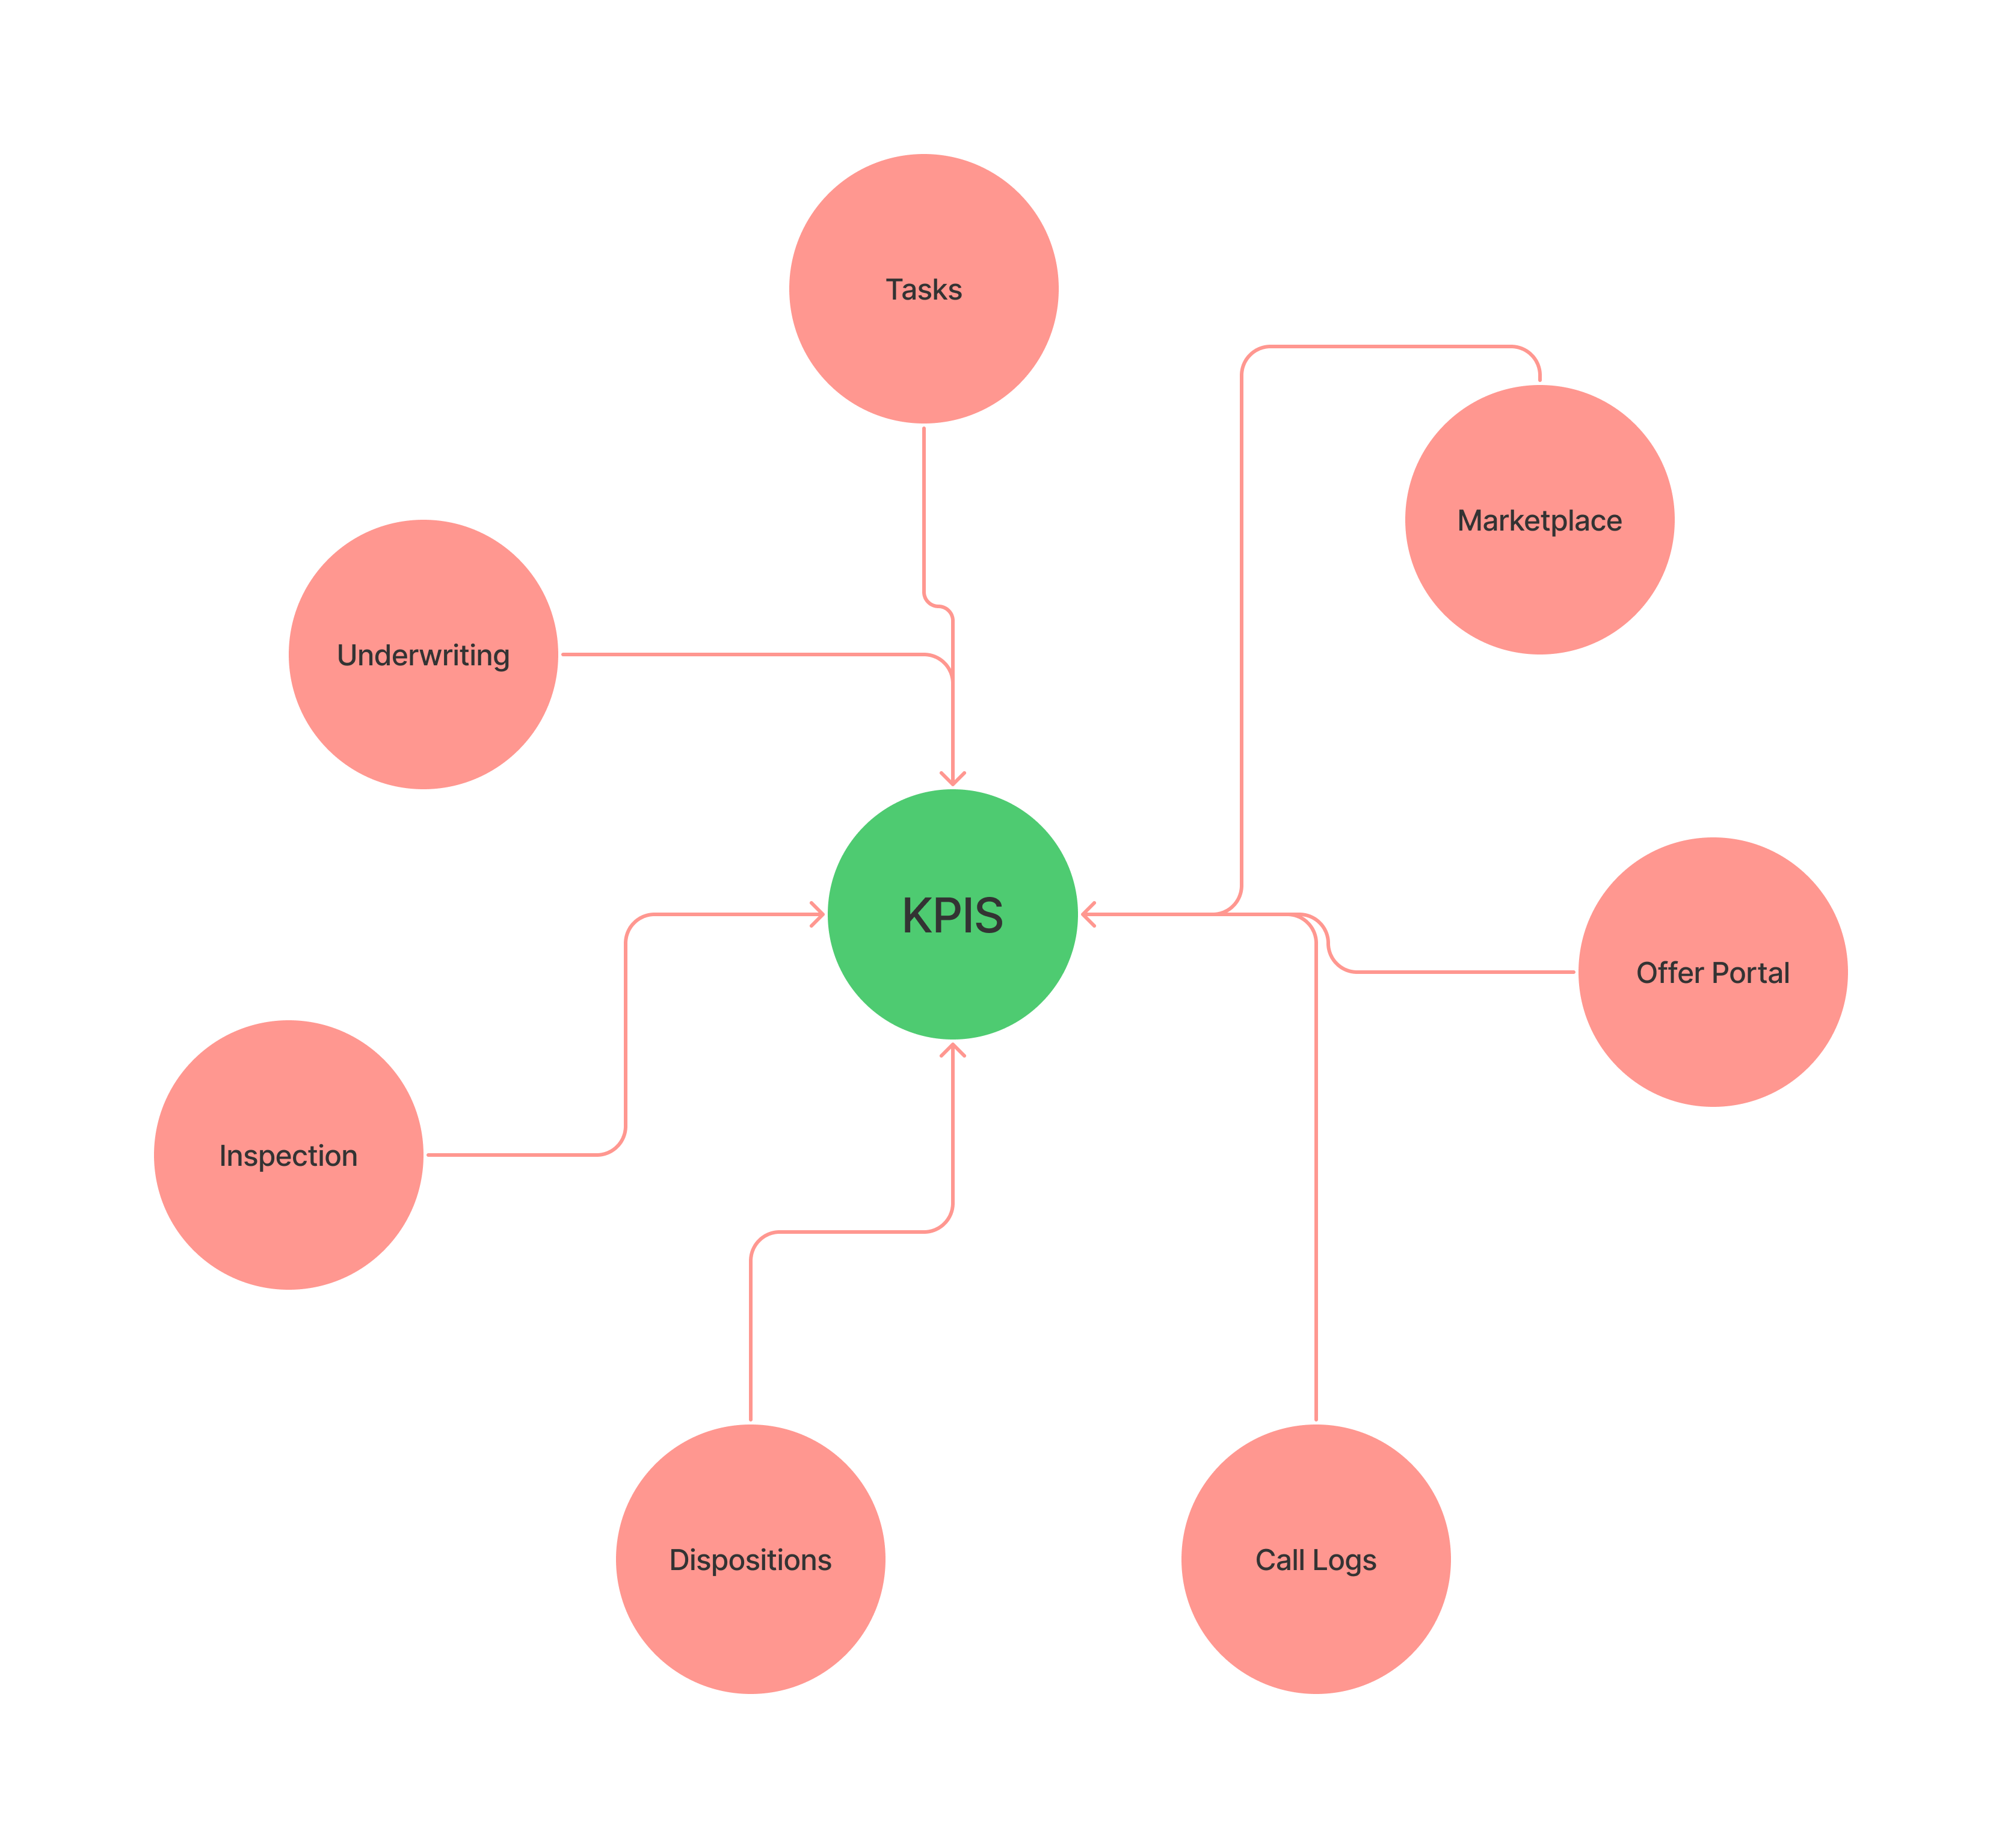
One of the features that was discussed at length and then deprioritized to later projects was the integration of KPIs into personal dashboards. With the wealth of data we could be pulling in through the house purchasing process we would be able to track tasks and numbers at every step of the transaction and look for ways to optimize efficiency. Ultimately it was decided that the chat-feed and pipeline were large enough chunks to tackle in the near future and KPI integration was pushed to a later date.
Decisions
- Don’t worry about KPIs feature until a later date.
- Limit pipeline views to the relevant user via permissions.
- Sales - Limited to first 4-8 swimlanes
- Underwriting - Global view
- Renovations Project Manager - Middle 6-8 swimlanes
- etc.
- Combine the chat and communications with activity log on the overview page. Create separate section just for project activity for auditing and compliance.
Napkin Drawings
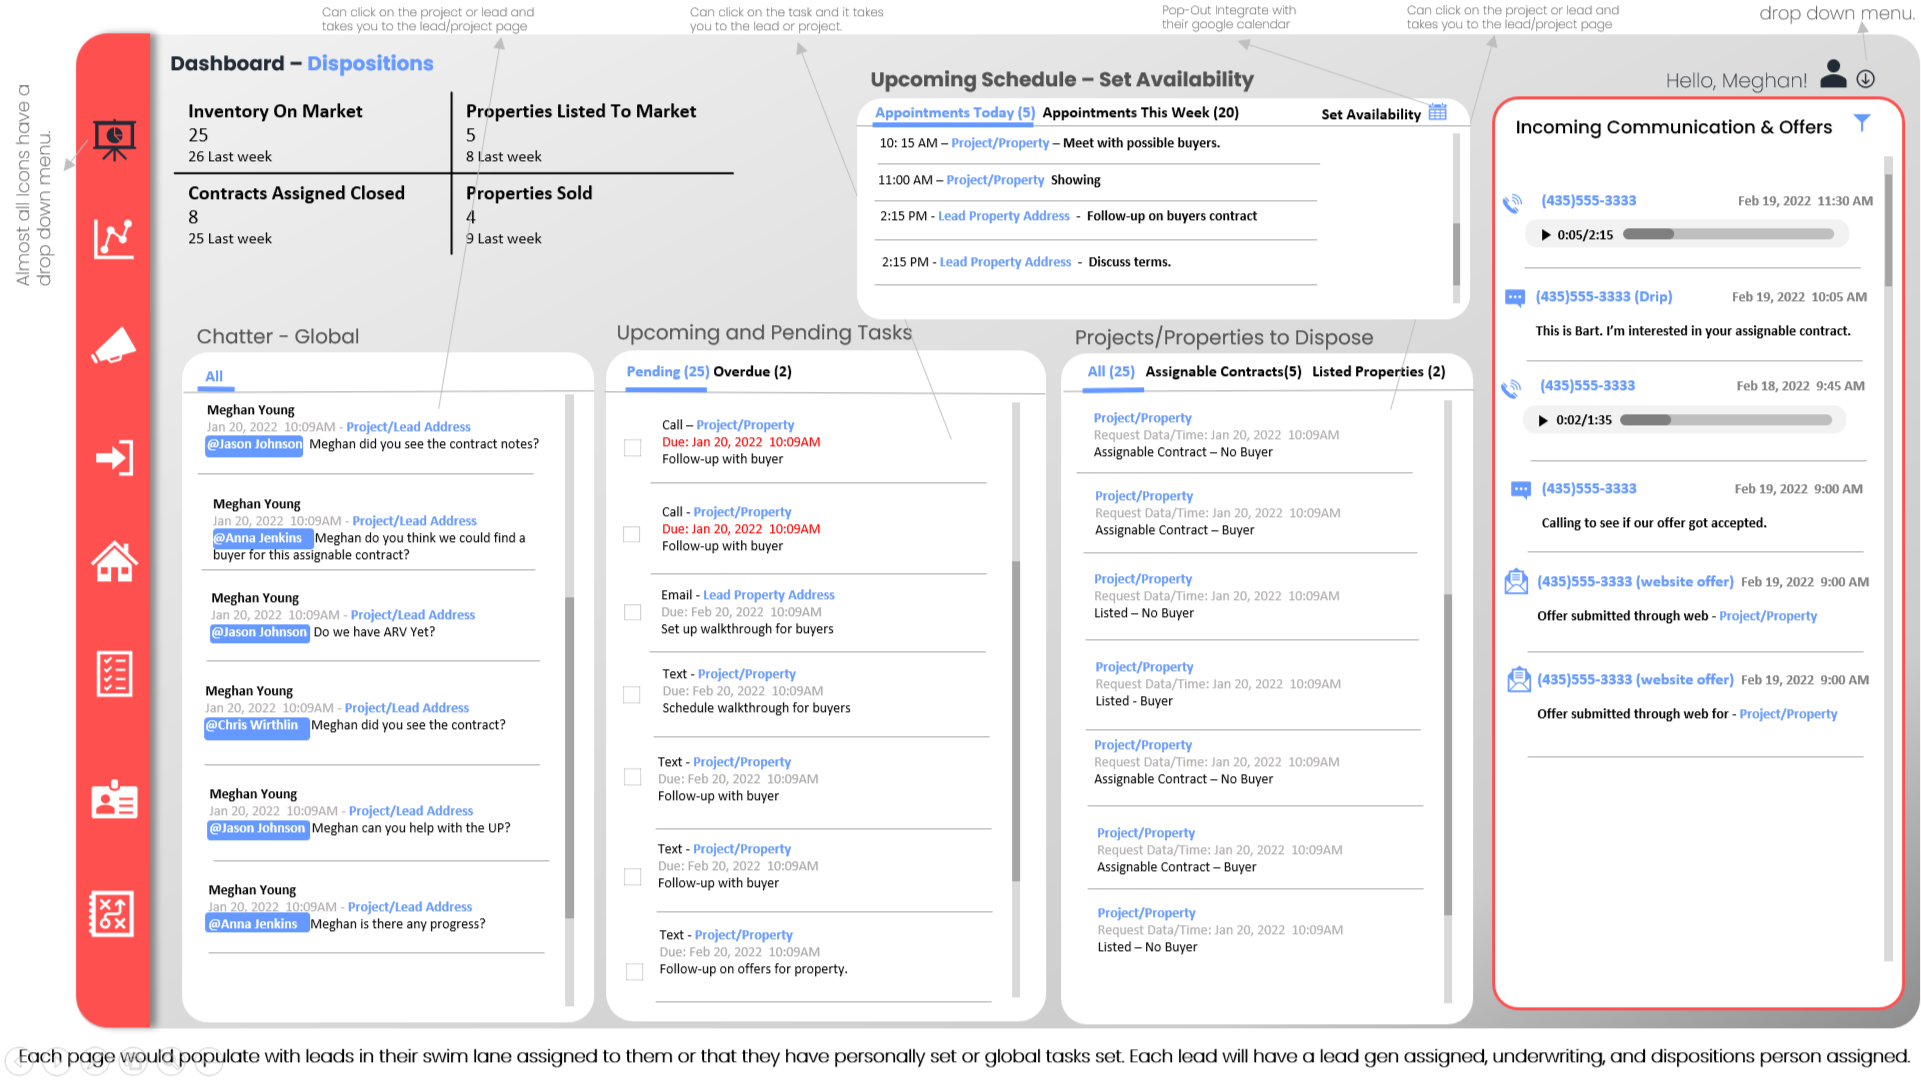
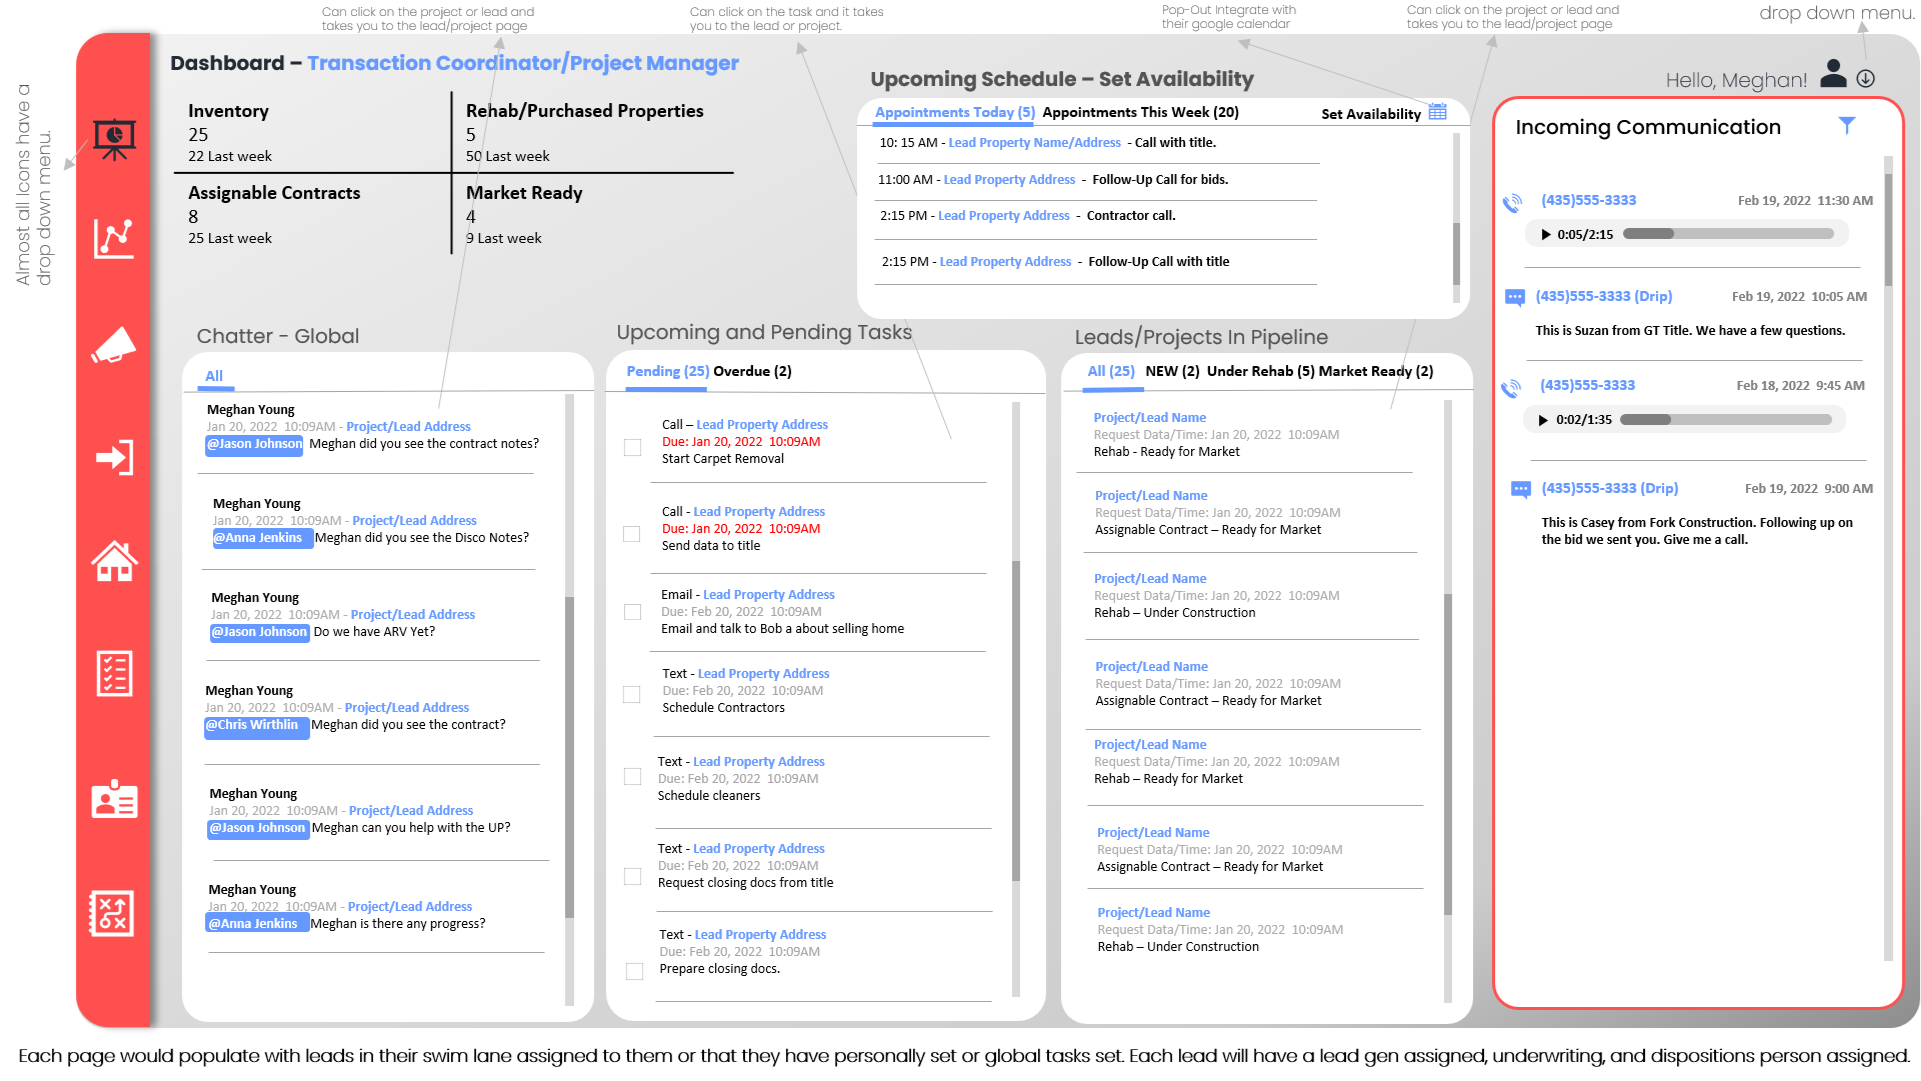
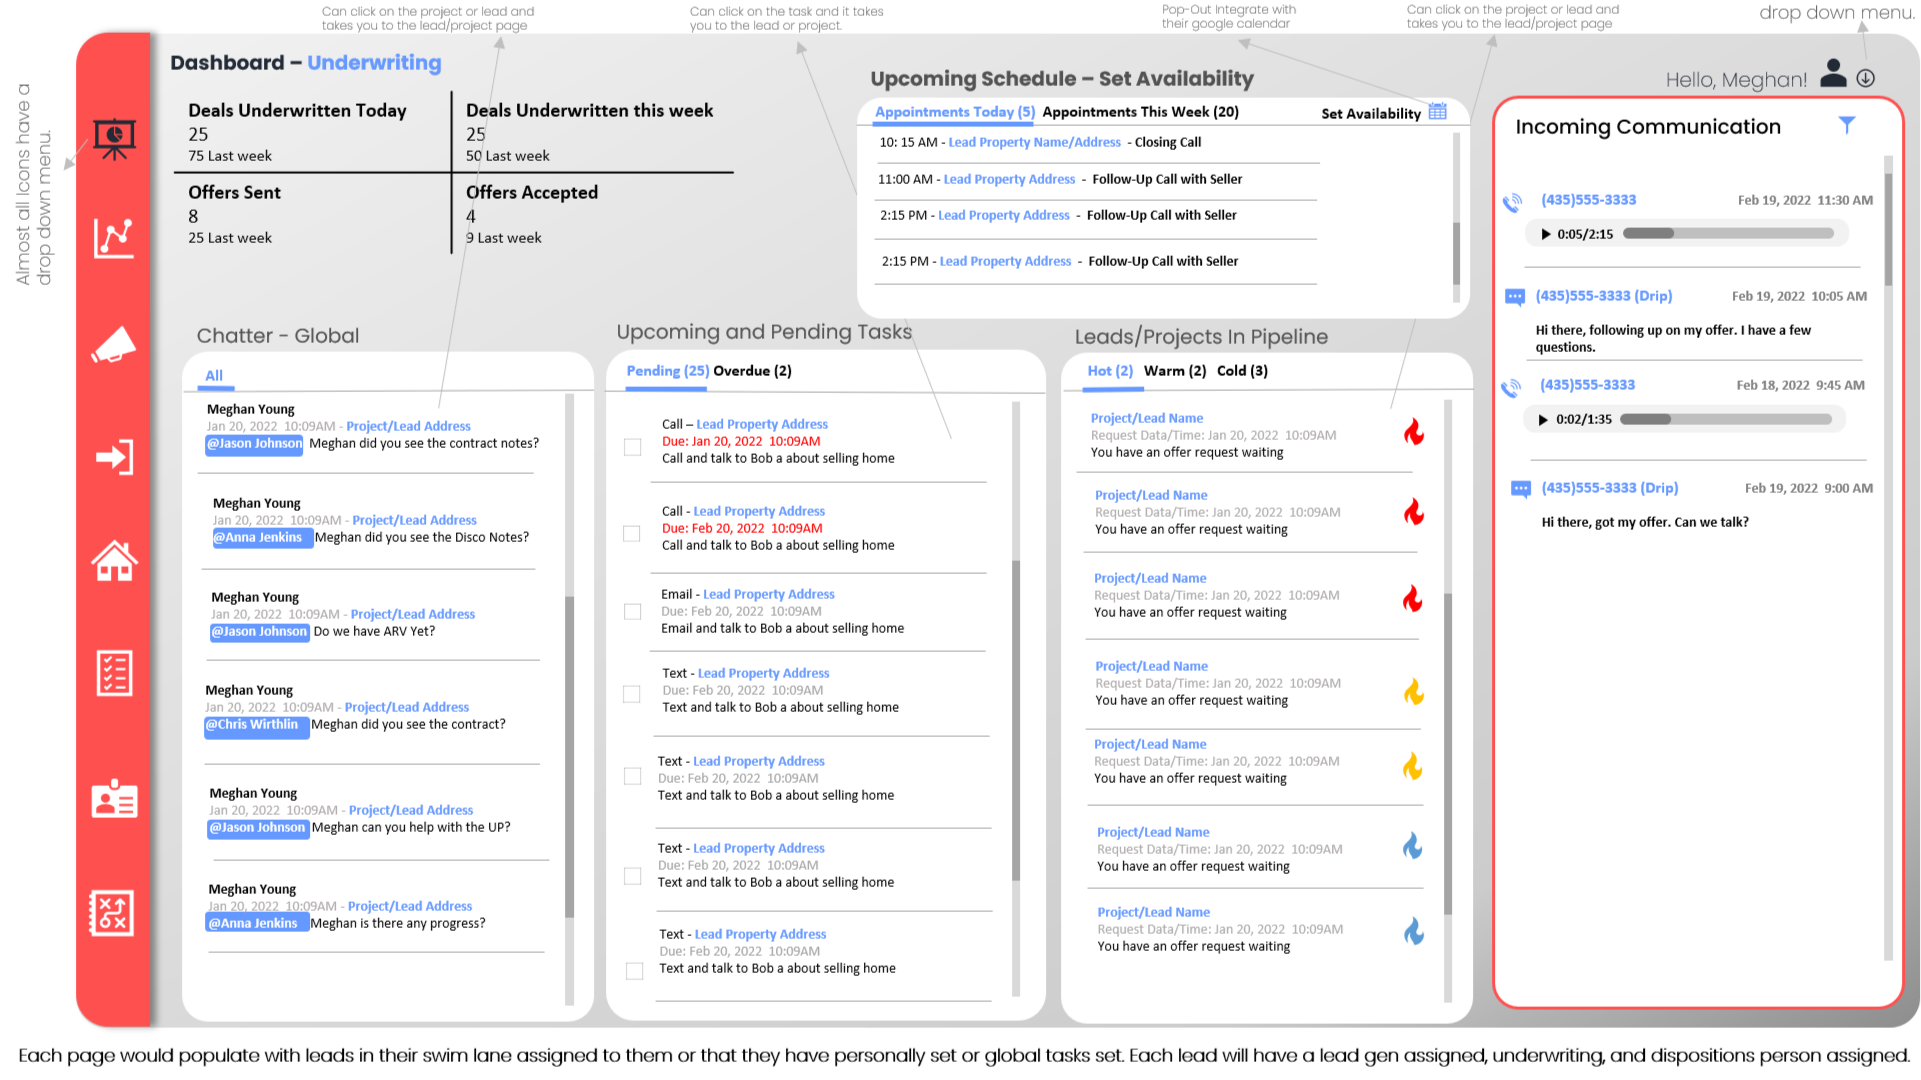
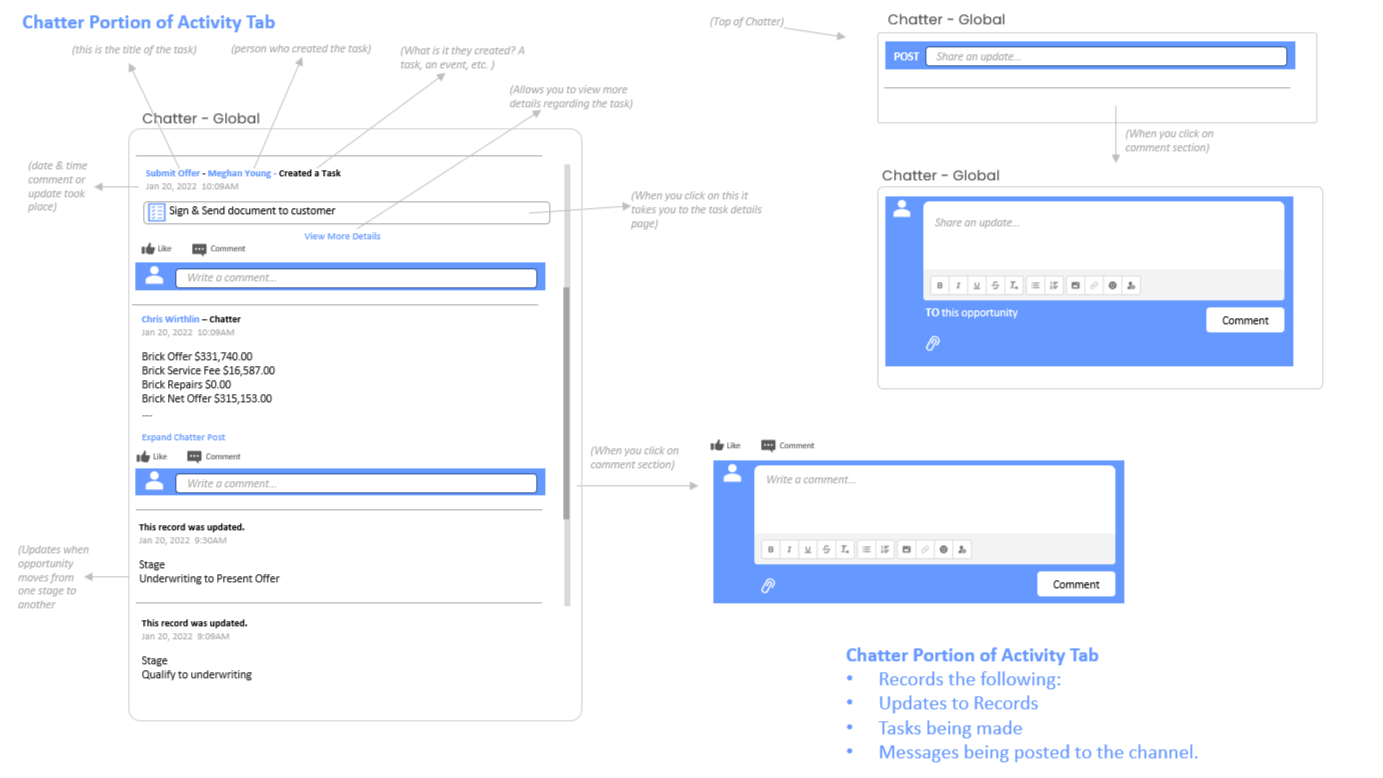
One of the stakeholders provided quick and dirty powerpoint napkin drawings to show exactly what information they wanted to provide to agents using the software. This was helpful in place of a list of data and gave me an idea of what was expected from the project.
The Chat Feed Wireframe
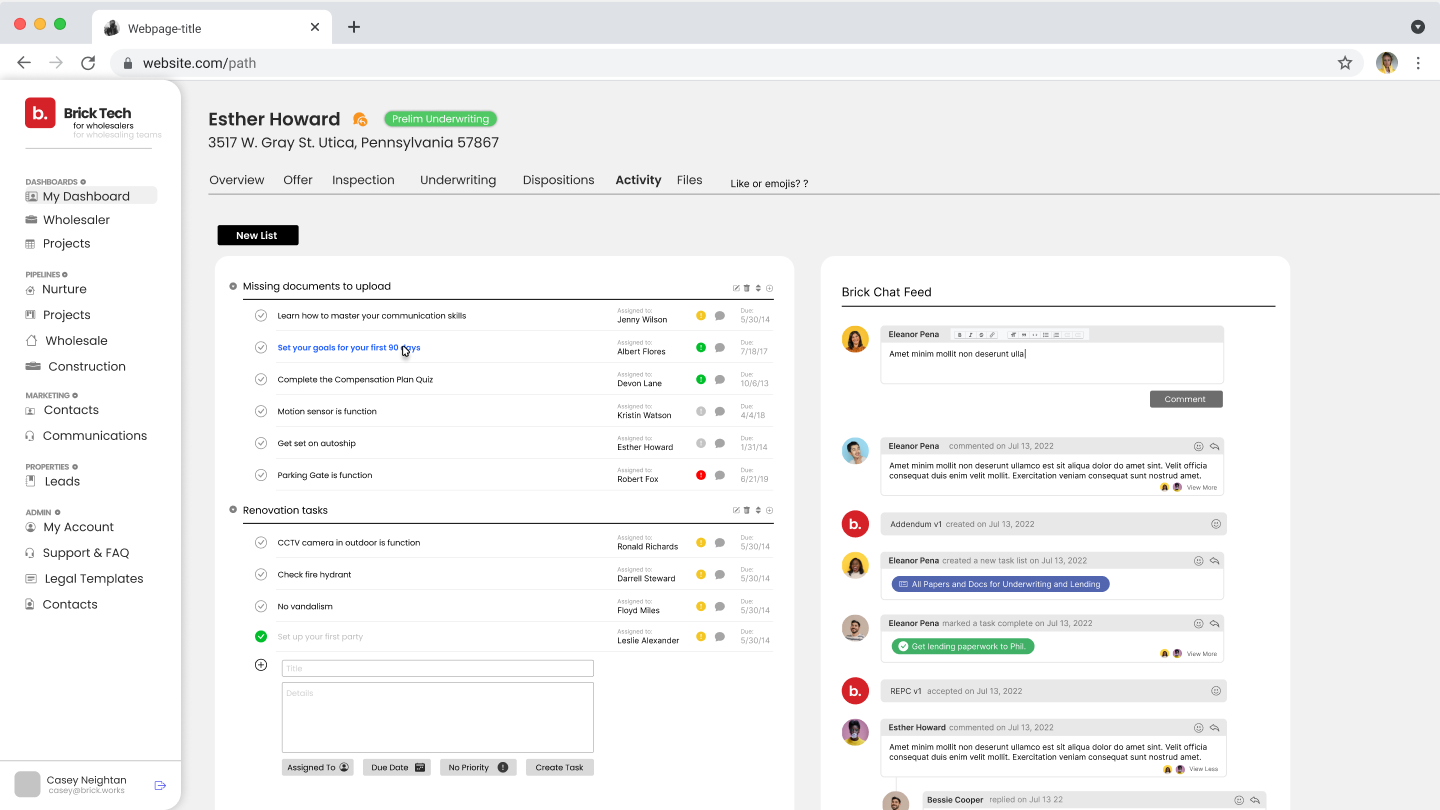
The chatter or chat feed portion of the project was the feature that experienced the most revisions as we had to take into account building an activity log into each project, something that we could use to audit or transactions and interactions with customers but also retain legal records for financial and tax reasons.
Design & Prototype Solutions
The Chat Feed
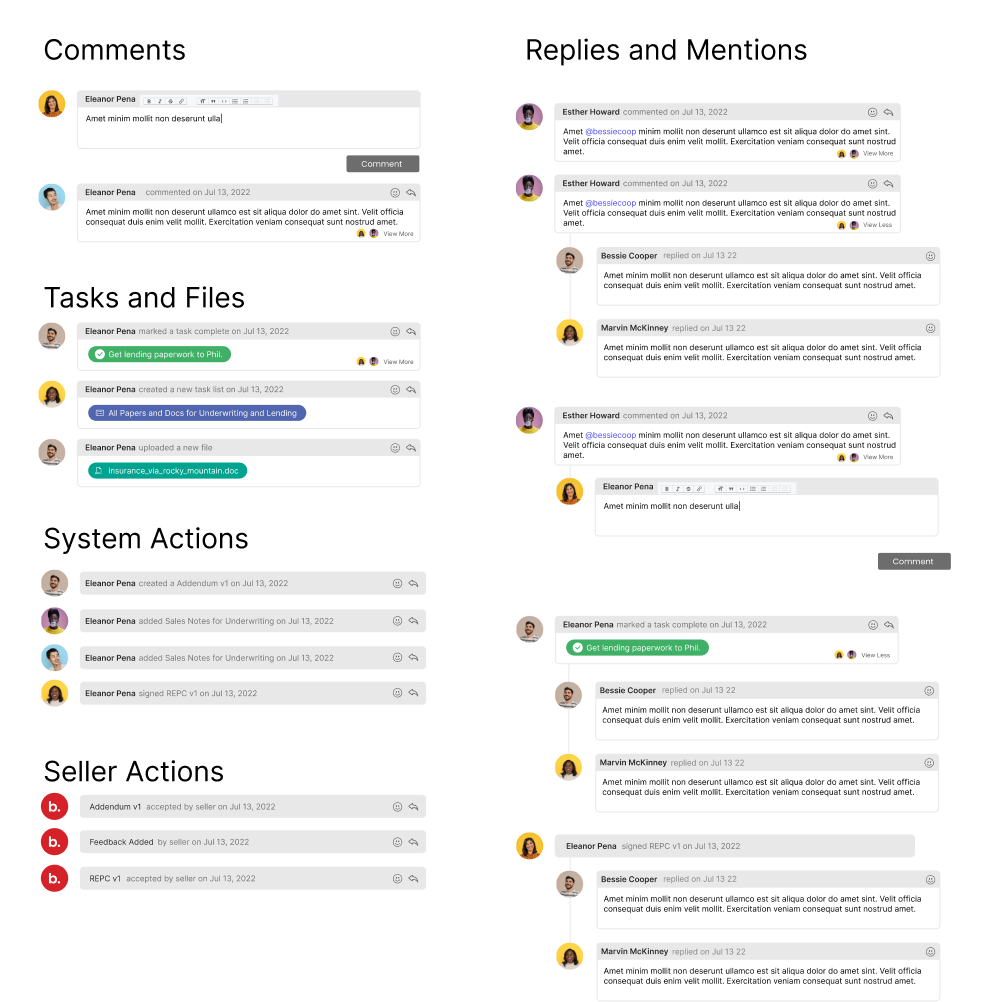
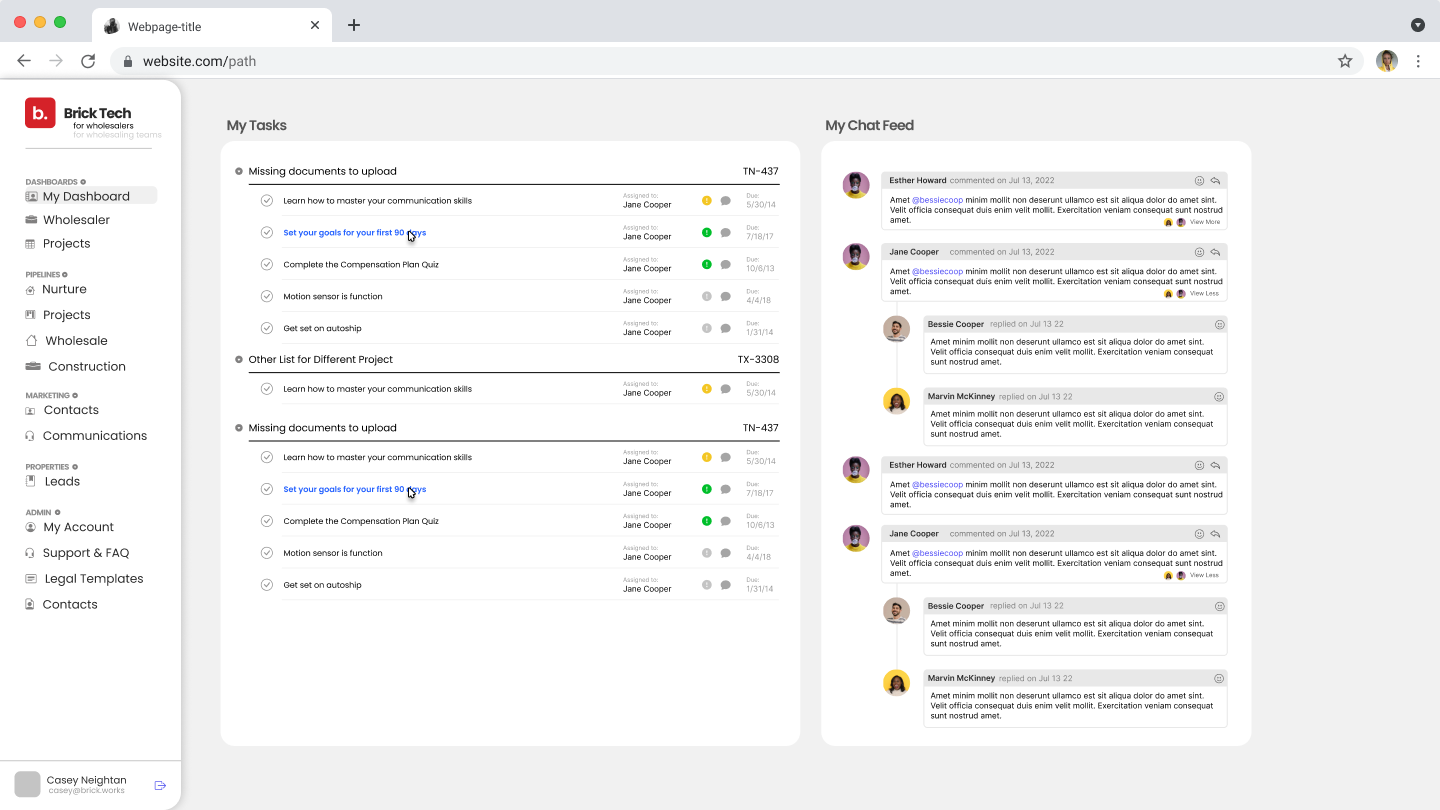
Based around the Github model for showcasing comments, this set of tiles and cards were used to present the capabilities of the chat feed to track activity across a property transaction as well as communications relating to that project.
Originally structured as more of a chat app like telegram, slack, or discord we moved to a more traditional forum based approach to facilitate the new system and user actions that needed to be logged.
User Dashboards
While KPIS were put on hold we ned we wanted to make space so that when we came back we had room on user dashboards to express the numbers and interactions that would be valuable. placeholder data was put in to bring some limited value even if it wasn't as dynamic or personal as a final KPI feature would be.
Project Based Task List
We decided to move forward with an information hierarchy surrounding the transaction project as the basis. This allowed us to attach tasks, chats, and activities to a single project rather than a single user. Permissions were also a consideration.
Project Pipeline
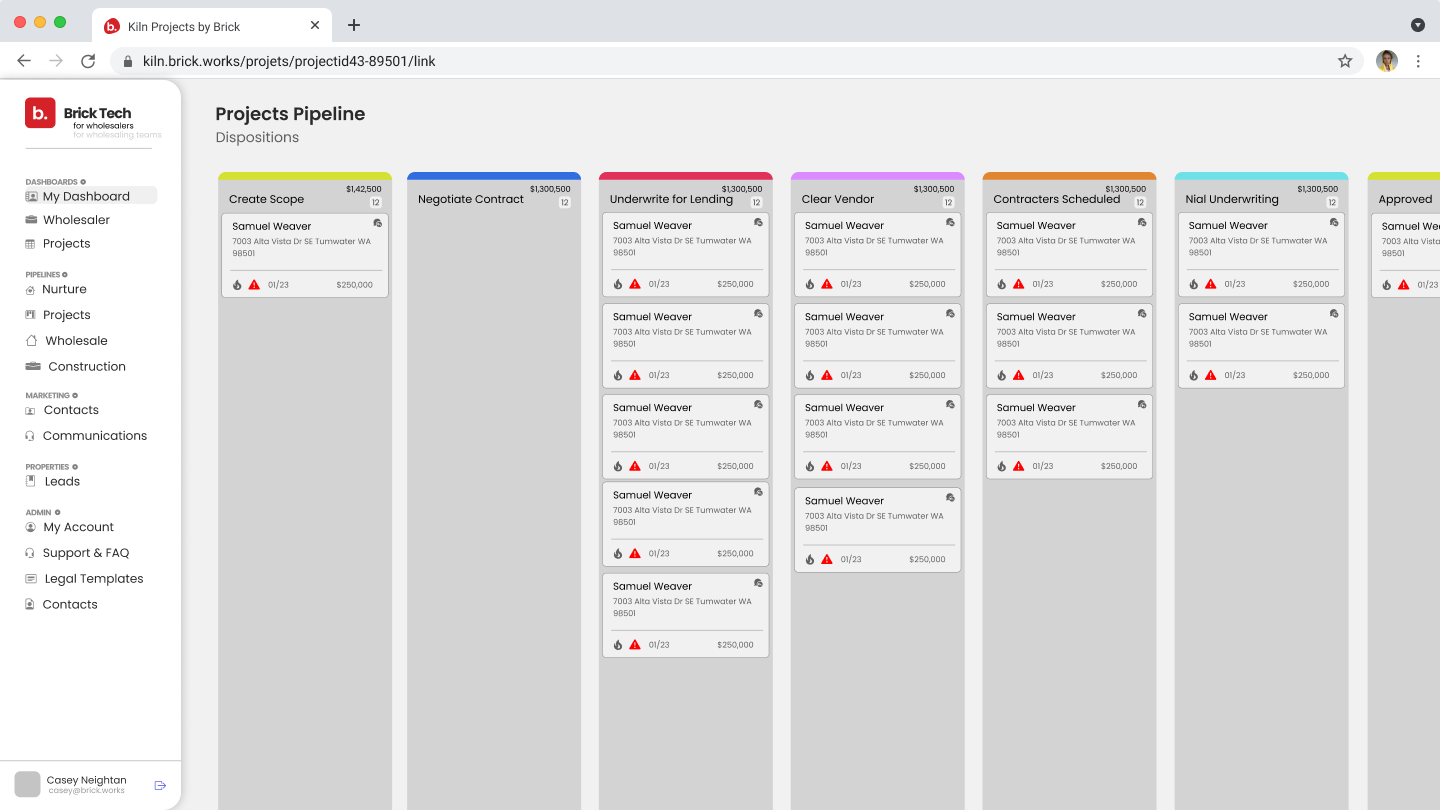
The pipeline was an undertaking because we needed to support the stakeholders request use permissions based views of the entire workflow. so while there were over 15 swim lanes in the process each agent would only see the 5-8 that their role was required to touch. The exception was the property underwriting team that would need the global view.

Test & Iterate
I provided prototype designs to stakeholders and agents to review and the key take-aways were:
- They loved the draggable cards for swim-lanes and the changing views depending on where you looked and who was logged into the system.
- They requested some minor changes to the information displayed on the swim-lane cards to better serve the transaction process.
- There was a high demand for the notification feature something that we would need to prioritiz sooner rather than later.
- We were notified we needed to add more system events to the task list for editing, deleting and re-assigning tasks instead of only completion and creation.
Lessons Learned/Final Thoughts
This was a fantastic project and I’m so grateful I got to work on it. It was a marathon of interconnected systems that each needed small udpates. One of my key learning points was how important it is to scope out the work and ensure your working on the best thing. This was a complex project with a lot of moving parts and even working as hard as we were we still missed out on some of the critical system events that were needed in the log.
Im glad the research we put in and breakdowns we built were informative and allowed us to delay the KPI feature until later as it definitely would have had an impact on the quality of work that I was able to put out. Though it is a fun design feature that would be interesting to tackle someday.
